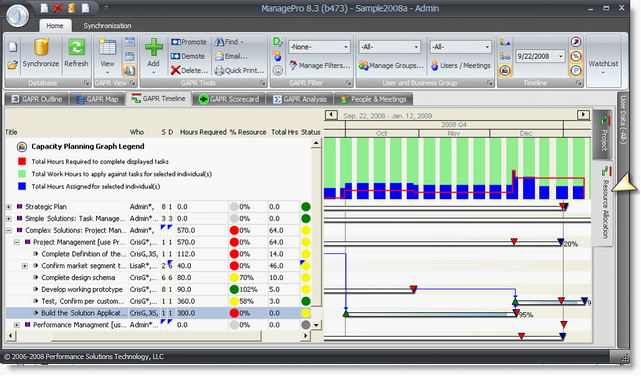
Choose the Resource Allocation view within the Gantt Chart view to start. This defaults to the columns below (which you can customize), and gives you an immediate over-view of projects assigned to who-ever you’ve selected in the User drop down list, or your entire scope of work by choosing “-All-“ in the drop down list.
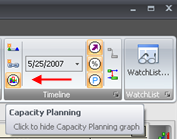
Note: Clicking the Capacity Planning Toggle Icon will show or hide the capacity planning chart while in the Timeline|Resource Allocation View


Columns in the Timeline|Resource Allocation View Above
1.
|
Hours Required – This column displays the number of hours required to complete the task that you have entered from the details view. This is a rollup column, so the numbers sum up or are totaled at the parent goal level.
|
2.
|
% Resourced – This column calculates the % Resourced by dividing the hours allocated (entered in the previously discussed Resource Allocation tab form) by the hours required to complete the task, and it adds a color globe for extra visibility.
|
3.
|
Total Hours – This column sums the total hours that have been entered against this task via the ManagePro time cards (available under the Details/Time Card tab).
|
This gives you a quick overview of what’s resourced and what isn’t and you can further focus this view by filtering for priority (checking to see that all priority one tasks are resourced) or by date range or by both. But there’s more, let’s turn our attention to the Capacity Planning Graph over the top of the Gantt chart area.
4.
|
Red Line – The red line represents the total number of hours required to complete the tasks displayed below on each given day. Note that the line continues through weekends, even though no required hours may be scheduled for that time, to aid visual continuity.
|
5.
|
Green Bar – represents the total working time available for user(s) selected
|
6.
|
Blue Bar – represents the total number of hours allocated displayed tasks and red line required hours.
|
|