Navigation: Resource Allocation Overview > Personnel Allocation |
|
Personnel Allocation
The Resource Allocation sub-view within the People/Meetings tab provides an over-view or the allocation loading for each individual (or your entire group). You can view allocation across time and projects, by person or by group, or select the -All- option at the top of the User Drop down menu to get a valuable look at where all of your people are allocated to spend their time. Even if you only do this at a high level, it generates an important look at where you're spending your staff's time.
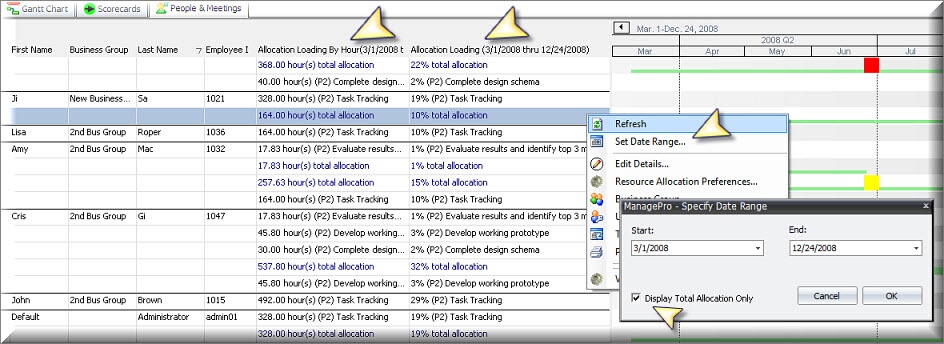
1. The Allocation Loading by Hour column tracks the number of hours on each project a person is assigned to during the Date Range you establish.
2. The Allocation Loading column takes the hours assigned to each project in a date range and calculates what % of time across the date range that it represents.
3. Using the Right Click menu, you can set the date range for days, weeks, months or years to zoom in on just the time span of interest.
4. When in the Set Date Range option, you can also specify that you only wish to see the summary of hours, by clicking the Display Total Allocation Only and not the details across each project (see second screen shot below).

You see the same date range, but in Summary format in this second screen shot. Remember by moving your mouse over the duration bars on the right, you will see the % allocation for each task, with the addition of height and color (ex. allocation over 100% turns the duration bar red for as many days as that allocation loading exists) to make it easier to recognize allocation loading at a glance.

The graphical timeline region can be expanded or contracted in span by using the left mouse click cursor movement, when the cursor is at the top of the screen. You can also move the graph forward or backward in time using the arrows on the timeline’s upper left and right corners. Hovering your mouse over any section of the bar charts will display what tasks the individual on that row is assigned to, and what % of their time is allocated to the tasks on that date.
To use, simply right click in this view and choose “Select Date Range”. This automatically configures the timeline graph to display this date range selected, plus identifies each task an individual is assigned to during the date range selected. It then lists each task and its assigned priority for each individual.