Please be sure to view a quick over-view of the Timeline or Gantt chart view in ManagePro and how to work with-in it.
Working with the Timeline View
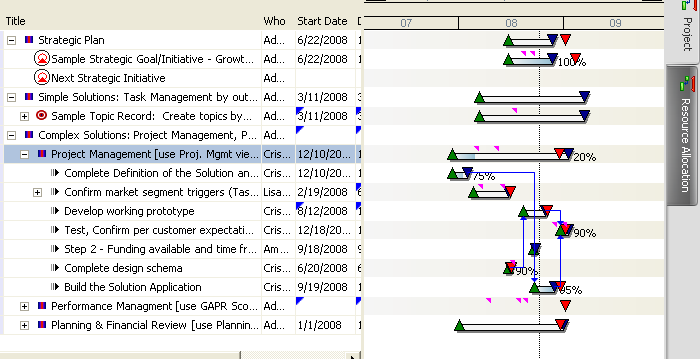
The Gantt Chart view displays the goals in outline format but also adds a Gantt chart display which shows timelines between the Start and due date of each goal. The green triangle designates the start date of a goal and the Blue Triangle shows the Due Date. You can click on either end of a timeline and drag and drop to adjust the dates of any goal. Notice that it does remember the original due date and displays a Red Triangle at that point on the timeline. At a glance you can then tell if a project has slipped its Due Date or is finishing ahead of schedule. Buttons at the top allow you to show when Progress Notes have been added to goals as well as what percent complete each goal is set to.

Progress Updates and Percent Complete Labels can be displayed next to goals in the Gantt Chart by selecting the purple arrow and % icons as shown below. You can toggle these on and off. Turning them on enables you to show when Progress Notes have been added to goals as well as what percent complete each goal is set to.

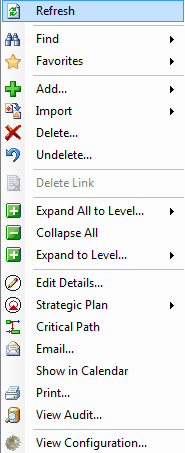
The following functions can be performed when options are selected from the Gantt Chart Right-click menu

See also:
Right-click Menu Options
|