Dashboard Configuration
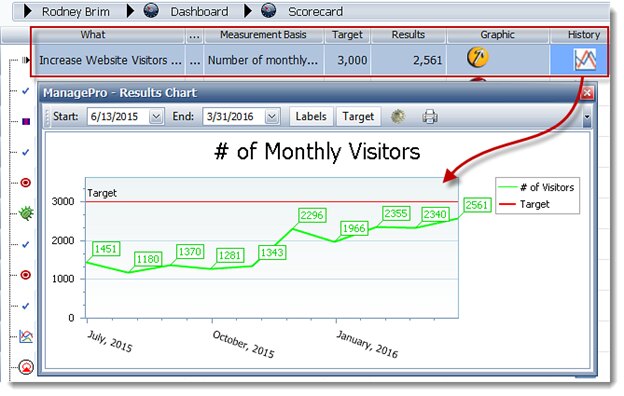
ManagePro 12 builds on previous scorecard features and offers an expanded set of tools and features to cover an expanded set of variables to support tracking metrics, outcomes and results for your projects and initiatives in the in your new Dashboard view. This enables you to track both the current status of what’s most important, and the history of your efforts as displayed in the screenshot below.
This document is intended to walk you through how to set up the needed scorecard settings for any record, such that you can see it displayed in your dashboard. Setting up a dashboard or scorecard configuration for any particular record can be accomplished using You’ll find this view within (as a sub-view) the Dashboard Configuration details view of any record you click on in the Main Workspace, Gantt or Mind Map views. To enumerate how to set up a dashboard for a particular record, just a few of the changes, we’ve broken up the Dashboard configuration window into sections. Please refer to the screenshots and enumerated text the screenshot below..
We will start with how to set up the scoring system to support a dashboard based upon the values input manually into the Results field via progress updates. This is the simplest approach to setting up the dashboard. Let’s go through it heading by heading:
Manual Updates:
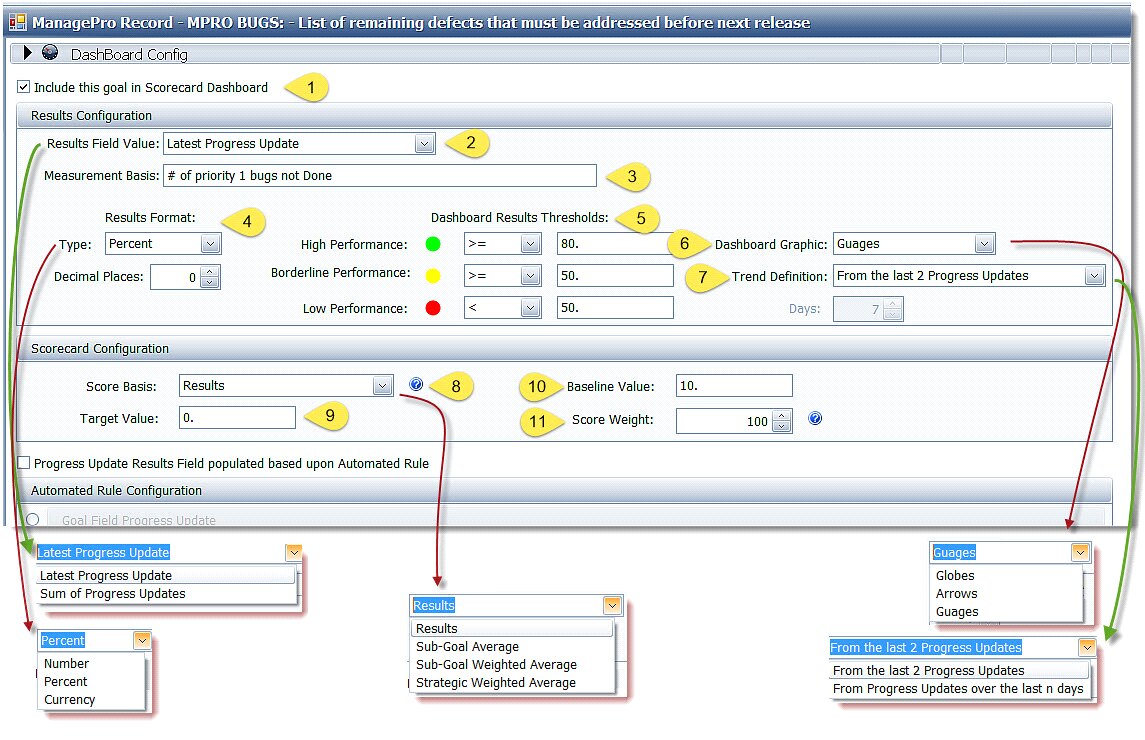
| 1. | “Include this goal in Scorecard Dashboard” – is a checkbox that must be checked to add score carding capability to this record and cause this record and it’s scorecard graphic (globes, arrow heads or gauges) to display in the Dashboard view. |
| 2. | “Results field value” – This allows you to calculate the scorecard based upon the most recent (by date) Results value entered (in a progress update), or by summing all the results values entered via progress updates to date. (Ex. You may want to track your Customer Satisfaction Score and cause the scorecard to display the result from the most recent survey, or you may want to track payments that have been made against a record and total them so that the scorecard displays how close you are to reaching the final number.) |
| 3. | “Measurement basis” – This is a text description field to describe what is being measured by the scorecard in the dashboard view. |
| 4. | “Results Format” – The Type field formats the display of the results in either a numeric, percent or currency format. The Decimal format controls the number of decimal places used. |
| 5. | “Dashboard Thresholds” – This area allows you to determine the color of the graphic images based upon the score or percentage the record’s scorecard has reached its target. Be sure to set the greater and less than parameters such that they don’t create any ranges that are not covered. For instance, if you set Green to be above 80% and yellow to be below 80%, a score of 80% would fall into the range not scored, and the graphic would be a grey (not calculated) color. |
| 6. | “Dashboard Graphic” – Each record can display with one of three graphic images to communicate the results and resulting scorecard in the Dashboard view. Choose from either a globe, arrow head or gauge image to suit your preference. |
| 7. | “Trend Definition” – Within the globe and arrow head graphics, ManagePro calculates the trend (increasing or declining) as well as the current score. This trend has two basis of calculation. You can either select the trend to be: |
| a. | Based upon the most recent two progress result entries, or |
| b. | ManagePro will assess all of the results entries, split them in half and calculate the trend based upon comparing the second half of the results entries as either increasing or declining from the first half of the results entries over the duration you specify. |
| 8. | “Score Basis” – This option enables one of four calculations to be used in deriving the scorecard score, as follows: |
| a. | Results – this uses the latest value in the results field (of the most recent progress update) |
| b. | Sub-goal Average – this uses the average of the scores for any sub-goals that have been set up for inclusion in the dashboard |
| c. | Sub-goal Weighted Average - this uses the average of the scores for any sub-goals that have been set up for inclusion in the dashboard as modified by the weight assigned to each sub-goal using the “Score Weight” field. E.g. the Weight is multiplied as a % times the Score. |
| d. | Strategic Weighted Average - this uses the average of the scores for any records that are strategically linked to the identified record using the right click Strategic Plan/Link… option, as modified by the weight assigned to each linked record using the “Score Weight” field. |
| 9. | “Target Basis” – This is the results value that reflects your target goal. The score calculation needs a target to compare your latest results against to generate a score. The target basis is equivalent to the value that represents target achieved, or a score of 100%. |
| 10. | “Baseline Level”- This is the score that reflects your starting point or a value of “0” for the purpose of calculating over the course of time, what % the results have achieved in terms of reach the Target. Most commonly this is set to a value of 0. Note: If the target value is lower than the baseline or current results level (ex. a burn down or reduction of some type), then set the Baseline to either the current results level or a range above the Target that gives sufficient room to track progress in tracking what is being lowered. For instance if your target was 0 errors each month and your current activity generate 5-7 errors a month, you would set the target to 0 and your baseline to something above 7, such as 10. |
| 11. | “Score Weight” – The Score Weight is displayed to easily assign a weight value to a particular record, and is useful when calculating the overall score for a parent or strategic record. Think of assigning various weight to the supporting sub-goals with a total of the weights that equals 100. |
Automated Updates
ManagePro also supports a variety of automated updates to the scorecard and dashboard process. Let’s start with a display of the options and then a quick explanation of the function of each.
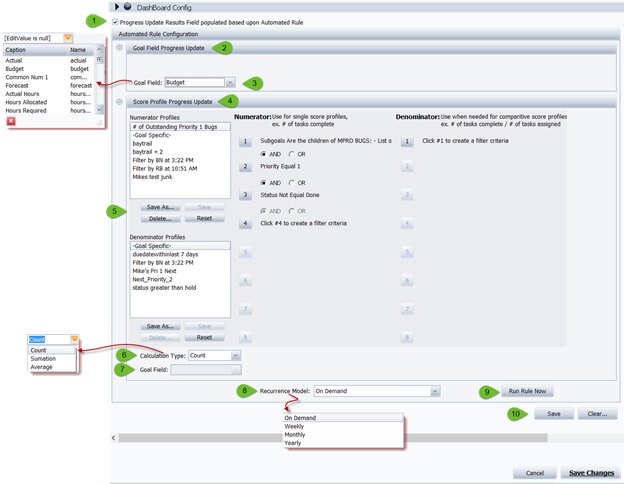
1. “Progress Update Results Field…” – If you wish to have ManagePro populate the Results field in an automated fashion (using a number of different calculation options) instead of manually inputting a number into the Results field you must check this box.
2. “Goal Field Progress Update” – Check this box if you wish to simply pull the value from one of the record fields from one of your workspace views and have that transferred directly into the results field.
3. “Goal Field” – Select the field who’s value for this record will be transferred to the Results field in a progress update entry. This process will occur at a time interval based upon what you select in options 8 and 9 below.
4. “Score Profile Progress Update” – If instead of pulling a value from an existing field, you wish the Results field to represent a calculated value, then check this button instead of the Progress Update Results Field button.
5. “Numerator & Denominator Profiles” - Calculations in ManagePro are constructed based upon identifying a specific numerator and denominator through filters. Once you have set up the filter to get the desired outcome, you can save both the numerator and denominator configurations as profiles, so that you can call them up for other records (so you don’t have to recreate them for each new record you have in the profile. In the example depicted, the value to be placed in the Results field is the number of bug records that are priority 1 and not completed yet. In essence it’s a “burn-down” report, summing the number of critical items outstanding.
Given that you may have thousands of records in a ManagePro, the specific intended sum is derived by filtering for only those records under a specific parent record (Mpro Bugs), that have a priority set of 1, and whose status is anything but “Done”. In this case no denominator is needed, but if we wanted to know the % of outstanding priority 1 bugs, over all those that had been completed, then we would have built in a denominator that matched the numerator, except that we wouldn’t have included a filter for Done, as we would want the total number of priority one bugs, e.g. out of n number of priority 1 bugs, what percentage are outstanding (total of priority 1 bugs, not Done/total of priority 1 bugs).
6. “Calculation Type” – If instead of simply enumerating the number of records defined by your filter combinations, you wish to apply a calculation to values in one of the fields in the records selected by the filter, ManagePro covers that as well. First select the calculation type, e.g. either count up the number of records that match, or sum the actual values in the field you’re tracking or average the values in those field.
7. “Goal Field” – Specify the field containing the values you wish to track and calculate a value to put into the results field. For example, you might want to total the Hours Required for just the tasks rated as priority one, so you set the filter to only pull priority one records, then set the calculation to “Total” and the goal field to “Hours Required”.
8. “Recurrence Model” – ManagePro will automatically calculate a value based upon the fields and records you have selected and place that into a progress update with the value entered into the Results field, and the calculation specifics listed in the comments field. Your options are to have such a progress update created either “On Demand” (e.g. when you click “Run Rule Now”), or the first time you open ManagePro on a weekly (first day of the week), monthly (first day of the month) or yearly (first day of the year) basis.
9. “Run Rule Now” – Clicking this button, executes whatever automatic configuration you’ve set up (even if you have set the recurrence to be at an interval that isn’t the current date), creating a progress update and placing the resulting calculation in the Results field.
10. “Save” – Clicking this button saves the dashboard configuration you’ve created.