Goal Related Icons
|
Description
|

|
A goal record of one or more types, (ex. Finance, Internal, Customer or Growth).
|

|
This is an Action Step, one of the key steps or milestones to be completed in the
Process of achieving a goal.
|
|
Depicts that a Task is related to a goal and/or sub-goal, and are usually indented one level and placed just below either the action step or the goal they support. Tasks function like a goal related Todo but with better visibility in the Main Workspace Views.
|
|
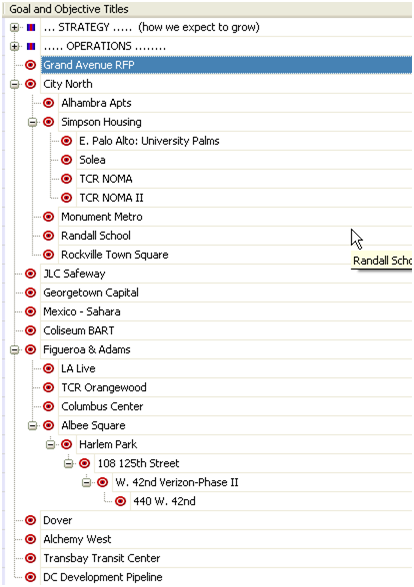
Appears next to parent goals and when you click on it the goal will expand the sub-goals underneath it.
|
|
Appears next to parent goals and when you click on it the goal will expand the sub-goals underneath it.
|

|
Appears next to parent goals and when you click on it the sub-goals underneath are hidden.
|

|
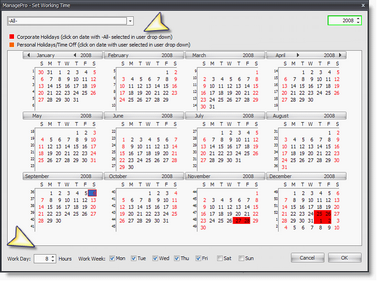
The % Complete fields functioning in a manual over-ride status are displayed with a blue triangle in the upper left corner of a goal record in the GAPR Outline and GAPR Timeline Views.
|
|
The Pink Triangle is displayed on the Gantt Chart when the Progress Update Filter on the toolbar is turned on. It indicates the date on which Progress notes have been entered for the goal.*
|

|
•
|
The Green Triangle designates the Start Date of the goal
|
•
|
The Blue Triangle indicates the Due Date of the goal
|
•
|
The Red Triangle is displayed if the original Due Date was changed
|
These indicators are displayed on the on the Gantt Chart
|
|
Enables Timeline Mode on the Gantt Chart; this icon turns grey when you are in create timeline mode, click again to exit timeline mode.*
|

|
Enables the ability to link goals on the Gantt Chart; this icon turns grey when you are in create link mode, click again to exist create link mode.*
|

|
Enables the selection of the start date range to display on the GPAR Timeline View – Gantt Chart. This is available on the toolbar when in the GAPR Timeline View.*
|
|
Click to show progress update labels in the Gantt Chart. This icon is only available on the toolbar when you are in the GAPR Timeline View. To remove the label, click this icon a second time, then click the timeline where the pink triangle appears.*
|

|
Click to show Percent Complete labels while in Gantt Chart. The percent label will be displayed at the end of the timeline in the Gantt Chart. This icon is only displayed on the toolbar when in the GAPR Timeline View. To remove this label from the timeline, click this icon a second time.*
|

|
•
|
The Score balls in the Scoring View indicate if this score value fell in the range of Satisfactory (Green), Unsatisfactory (Yellow) or Very Unsatisfactory (Red).
|
•
|
The arrow tracks the relative trend of the results scores that have been accumulated again the target objective.
|
|